High Quality Wow & Flutter — an Oxymoron?
We’ve said in a couple places that Wow Control (our latest plugin!) has a fancy, high quality wow & flutter algorithm. But what exactly does that mean? Isn’t the whole point of wow & flutter to not be so hi-fi?
Sort of.
The process by which wow & flutter occurs on analog playback devices — the speeding up and slowing down of the actual media — is different than what’s usually done to recreate it in a digital plugin.1 In the digital world, speeding up and slowing down audio (i.e. pitch modulation) requires realtime interpolation, sample rate conversion, or fractional delay filters.
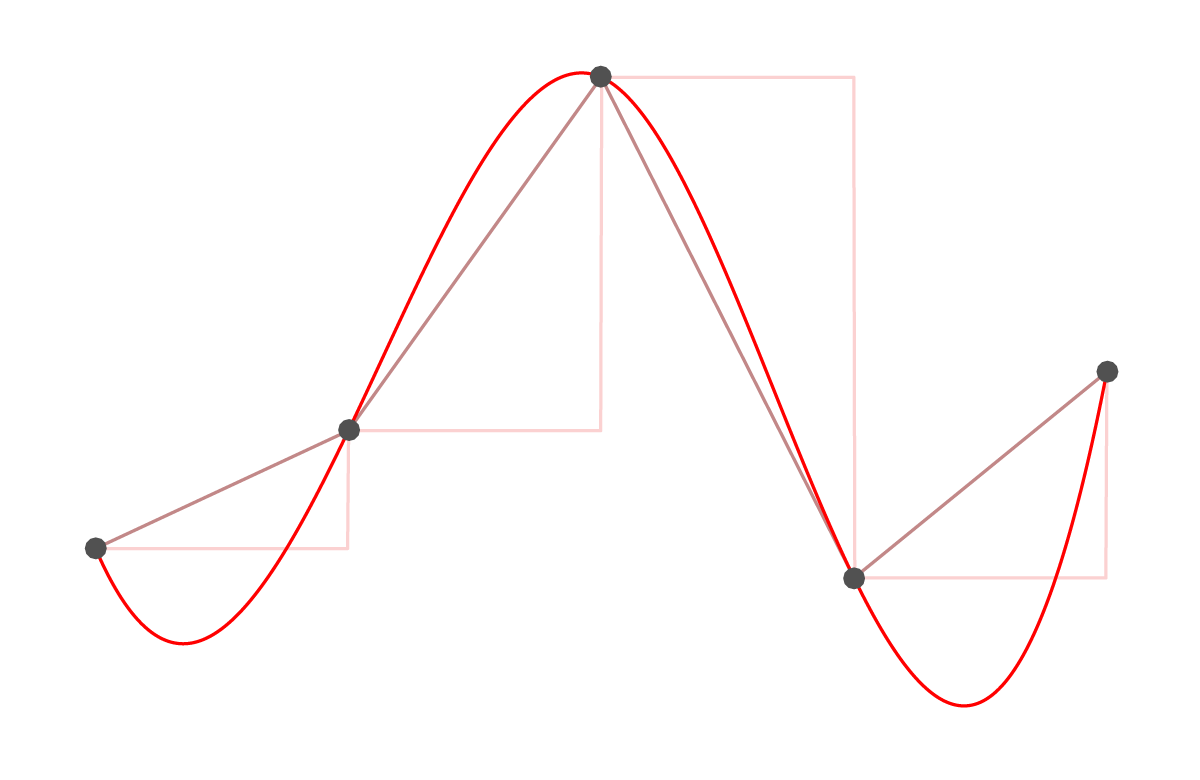
Interpolation is simply connecting the dots (i.e. creating new digital samples where there weren’t any before):

Without going into detail about the actual pitch modulation, it suffices to say that the quality and design of the interpolation matters a lot. Many tape-based plugins include some version of wow & flutter, but they often don’t give it much attention or CPU cycles. This is one of main reasons we wanted to devote a whole plugin to it with Wow Control.

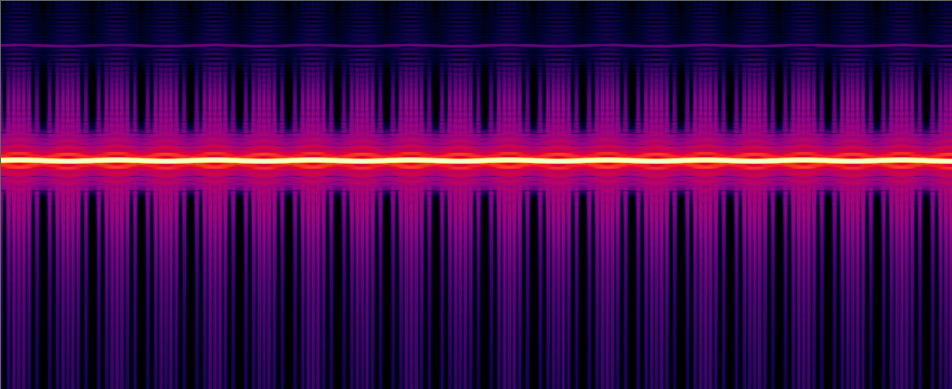
The image above is a zoomed-in spectrogram of a sine tone passed through a commonly used mastering tape plugin with wow & flutter.2 Notice the digital artifacts and aliasing around the bright sine tone in the middle. These aren’t an intentional part of the analog modeling, and they’re not part of the analog process. They are consequences of a poorly implemented wow & flutter algorithm.
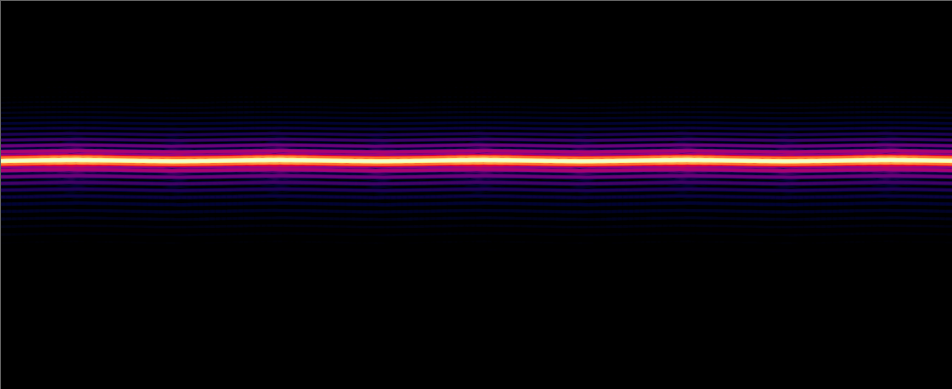
Compare to Wow Control’s spectrogram for the same amount of wow & flutter:

Ahh, that’s better. A nice wow-&-fluttered sine tone with minimal digital distortion.
The point of wow & flutter is to recreate the types of pitch fluctuations that occur when using imperfect analog playback devices, not to inject aliasing or other digital artifacts in the process, and that’s what we mean by “high quality” wow & flutter.
Want to hear it in action? Check out Wow Control!
-
Want to learn more about wow and flutter? Check out the Wow Control Manual ↩
-
3.15 kHz sine tone at -12 dBFS. The graph’s axis are 1 kHz to 6.1 kHz, -140 dB to -12 dB. ↩